RA: 21h27m13.7s
DEC: -12d09m46s
Redshift: 0.177
Nspec: 68
Radio: DR
Polarization: 22% (Bonafede et al 2009)
AV: 0.127
SDSS: N
HST: N
SUPRIME: Y
Comment: Boschin et al 2010
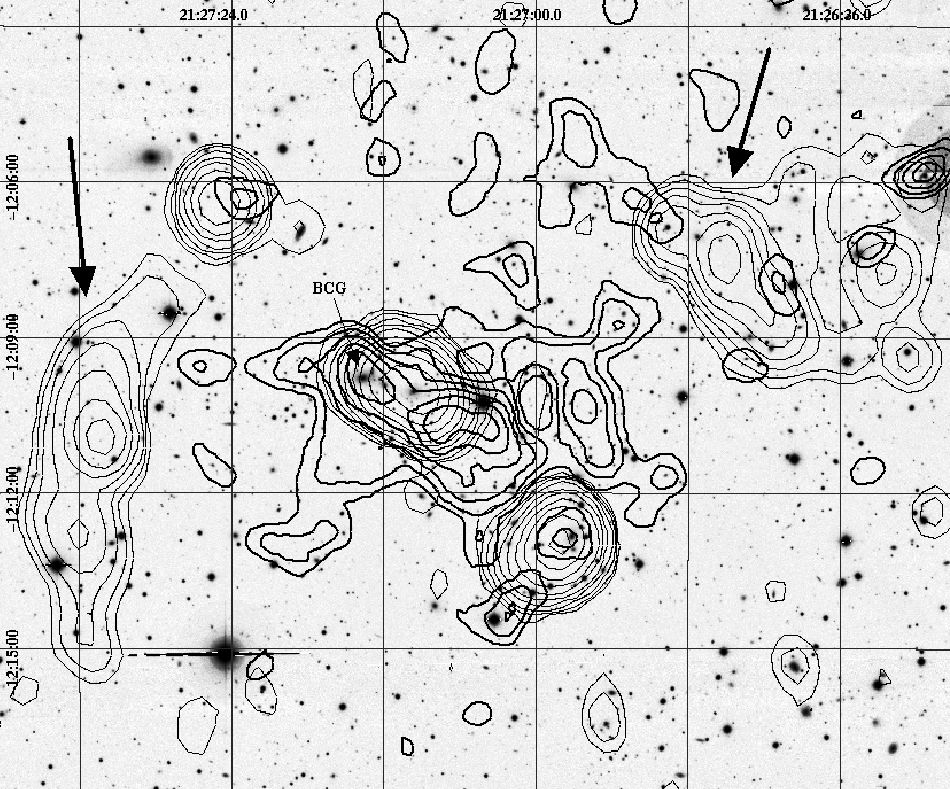
Bonafede et
al. 2009 analyze the radio relic, but Boschin
et al 2010 give a clearer overall picture including X-ray,
optical, and dynamical data. The image below is their Fig 1, which is
INT r-band overlaid with ROSAT (thick contours) and VLA 1.4 GHz (from
Bonafede
et al. 2009, thin contours; there are lots of radio contours in
addition to the relics (arrows) because there are several radio
galaxies in the cluster). With ~100 galaxy velocities, Boschin
et al 2010 identify 3 galaxy subclusters: East (the most massive,
including the BCG), Southwest (including the radio contours to the SW,
as it happens to have a radio galaxy), and Northwest (identifiable on
the image below by the NW extension of the X-rays). SW and NW have the
same radial velocity, but East differs by 800 km/s. Their scenario is
that a north/south merger between SW and NW is taking place
simultaneously with an east/west merger between (SW+NW) and E; this
explains the big relic to the east and the smaller peculiar relic to
the NW. They interpret the velocities as implying that the SW/NW
merger must be in the plane of the sky, while the (SW+NW)/E merger
must have a line-of-sight component. (Technically I suppose the SW/NW
merger could be at turnaround.)
And below we have an archival XMM image where I have schematically
marked the positions of the relics and of the three galaxy subclusters
identified by Boschin (for the East I actually used the position of
the BCG; their East position is on the eastern rim of my circle).
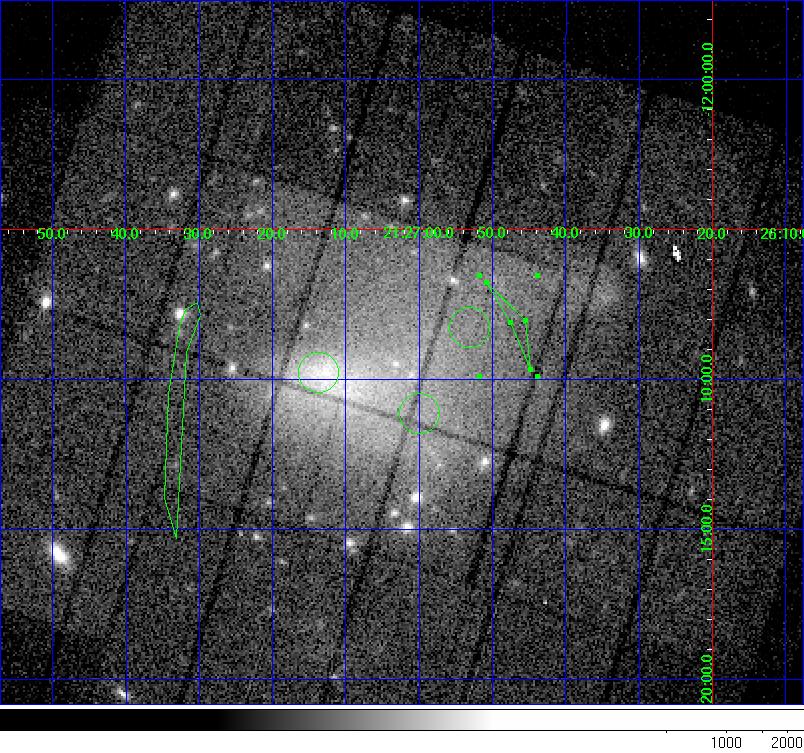
The position given in the table is the BCG position. The
positions in some of the older papers come from the X-ray position
listed in Ebeling et al
1996, but that ROSAT data is blown away by this XMM data, which to
my knowledge has not been published.
Imaging/weak lensing: if we wanted images the best bet is to get
it from the Subaru archive (8x4min in V band). Some previous images
were taken, but with a smaller field. In addition to the Boschin INT
r images, Cypriano
et al 2004 took VLT images (6.8' square) and did a WL analysis.
See their Fig. 8q for a low-res image. Dahle
et al 2002 also did a WL analysis using UH cameras and note that
"The cluster has a well-defined core dominated by a cD galaxy, and the
light and number density distributions both have peaks situated close
to the central cD....An archival ROSAT HRI exposure of 12 ks shows a
very large amount of substructure in this cluster, with multiple
subpeaks, indicating that it may be a dynamically young system." See
their
Fig 38 for galaxy density and mass maps. These old mass maps are
too small to be very useful. They cover ~6x6', which is 2x2 squares
on the first map above, more or less centered on the BCG. In other
words, they miss SW and NW.
Redshifts: I list 68 members because that's what's within 5' in
NED, but there are more outside this radius from the Boschin work.
Prospects: It does look interesting, but there are multiple
negatives in terms of early September Deimos observations. Most
importantly, it doesn't look dissociative. If the gas has not been
knocked away from the East, then there's not much chance of observing
the DM being knocked away. Second, it's a bit of a complicated
system. Third, we would need a heroic effort to process archival
Subaru data to assign slits for early September. Fourth, the
assumptions of Will's modeling code are clearly violated here so that
more spectroscopy may not help. A better approach may be to complete
multiband Subaru in late September so we can make decent mass maps,
and then interpret the system as best we can with the ~100 velocities
we have. Could be an interesting project to look for analogs in
cosmological n-bodies. But again, may not be a good lab for
SIDM.